Risk Assessment Heat Maps: Strategies for Effective Risk Management

Risk identification and assessment are essential processes for achieving an organization’s goals, particularly within a Governance, Risk, and Compliance (GRC) framework. It’s imperative to highlight key risks and develop responses that integrate an understanding of both risks and controls. The primary reason for conducting a risk identification and assessment process is to help determine the appropriate response to be taken for these risks.
The risk rating component of the process, in particular, can help organizations leverage their insights to build a multi-dimensional risk profile. That said, the traditional approach of plotting inherent risk and likelihood on a risk assessment heat map falls short of delivering a clear picture. Fortunately, better practices have evolved and we detail them right here.
What is a risk assessment heat map?
A risk assessment heat map is a visual tool that helps organizations assess and effectively manage their risk. By plotting risks along axes of inherent impact and likelihood, a heat map gives an at-a-glance view of potential threats to an organization’s goals.
However, this approach has its limitations. The reliance on inherent risk ratings — which ignore existing controls — can lead to an oversimplified and unrealistic view of risks, potentially failing to capture the complex interplay between different risks and their cascading effects.
Despite its limitations, there are several key benefits to risk assessment heat maps. Its visual nature provides an intuitive overview, enabling decision-makers to quickly identify and prioritize risks. Color coding and size variations help distinguish between different levels of impact and likelihood, allowing for efficient resource allocation.
The interplay between different risks provides a holistic view, supporting more nuanced decision-making that considers both immediate and long-term consequences, ensuring risk mitigation strategies are targeted and effective.
Also read: The Ultimate Guide to Risk Management
Inherent risk ratings vs. Maximum Foreseeable Consequence (MFC)
The inherent risk method often falls short in addressing the complexity of real-world scenarios. To combat this, many organizations have adopted an alternative rating: the Maximum Foreseeable Consequence (MFC). By focusing on the worst-case scenario that could realistically happen, approach method looks at what might occur if all the controls meant to prevent or minimize a risk fail.
The MFC method helps us understand how bad things could get, which allows us to plan and prepare better. It’s like having a fire drill for your organization, where you imagine the worst possible scenario to make sure you have the right measures in place to deal with it.
Meanwhile, inherent risk looks at how likely and how severe a risk would be without considering any controls or safety measures. It’s like asking, “If nothing were stopping this risk, how bad would it be?” MFC, on the other hand, takes into account both the existing controls and what could happen if they all fail. Overall, it provides a more balanced view by acknowledging that controls exist while still emphasizing the need to plan for significant failures.
Incorporating control effectiveness to visualize complex risk data
Control effectiveness refers to how well an organization’s controls mitigate risks, reducing their potential impact and likelihood. By incorporating control effectiveness as a third dimension, organizations gain a comprehensive view of their risk environment.
This additional layer provides valuable insights into the current state of risk management, highlighting areas where controls are strong or may require improvement. Assessing control effectiveness involves examining how well your controls are working to manage or mitigate risks. This includes looking at how often controls fail, how much they reduce the impact or likelihood of a risk, and whether they are implemented consistently. If a control isn’t performing as expected, you might need to strengthen it or find a new one altogether.
Control effectiveness is crucial in GRC because it shows how well your risk management strategies are working. If your controls are weak or inconsistent, even minor risks can lead to big problems. By ensuring controls are effective, you can confidently reduce both the likelihood and impact of potential risks. The end result helps your organization stay on track and achieve its goals.

A risk assessment heat map usually has two main axes: impact and likelihood. You can add MFC by considering the worst-case scenario for each risk and plotting it accordingly. To add control effectiveness, you can include it as a third dimension, either through color-coding or by adding an additional layer to the map. This gives you a more comprehensive view of your risk landscape, helping you identify which risks need immediate attention and how well your controls are mitigating them. It’s like adding depth and detail to a 2D picture, making it a more realistic representation of the real world.
Risk assessment heat maps can also incorporate velocity, acceptability, and external context, transforming traditional risk management into a dynamic, proactive process which offers:
- Strategic Visualization: Offering insights at a glance, allowing quick identification of areas requiring immediate attention.
- Prioritization of Resources: Highlighting areas of high risk and low control effectiveness, allowing effective allocation of resources.
- Enhanced Communication: Facilitating communication between risk managers and stakeholders, making complex risk landscapes easier to understand.
Discover Resolver's solutions.
Elevate your risk assessments with Resolver
Risk assessment heat maps are essential tools for visualizing and managing organizational risks. By adopting the MFC approach, incorporating control effectiveness ratings, and integrating additional factors like velocity, acceptability, and external context, organizations can create a robust framework aligning with modern GRC requirements. This transforms traditional risk management into a dynamic, proactive process that protects and enhances strategic decision-making within your organization.
Resolver’s Enterprise Risk Management (ERM) software enhances this process, offering a range of features that streamline risk assessment, provide real-time insights, and promote effective collaboration across functions. Our solution is simple to use, allowing for seamless integration into organizational workflows.
Our software also bridges the gap between compliance, audit, and risk functions, fostering collaboration and breaking down silos. Through this integrated approach, it’s easier to collect, escalate, and report on risk data, ensuring a cohesive response to emerging threats.
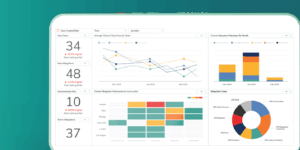
Additionally, Resolver’s ERM software generates meaningful, real-time reports, heat maps, and dashboards, offering a filterable view of risks, assessment data, controls, locations, and more. These insights are exportable at the click of a button, enabling management to respond quickly and effectively.
Resolver’s ERM software enhances the effectiveness of risk assessment heat maps, providing a single source that streamlines the assessment process. By bridging functional gaps, generating comprehensive reports, and standardizing risk management practices, our platform enables organizations to work smarter and deliver actionable insights.
Ready to transform your organization’s risk management? Request a demo today to see how Resolver’s ERM solution can simplify your workflows, improve collaboration, and enable data-driven decision-making.