Are you looking for ways to elevate your physical security game and take charge of your data-driven decision-making? As today’s corporate security leaders know, data is key to driving impact and success.
But when it comes to corporate physical security, there’s often a lag in collecting and utilizing data effectively. What are the best physical security reports that show your team as strategic partner driving the business and unlock the funding you need?
Don’t get left behind — watch this engaging webinar where we’ll discuss the top 10 reports that every corporate security team should have at their fingertips. Not only will you learn how to collect the data you need to stay ahead of threats and incidents, but you’ll also discover how each report can support decision-making and help you prove the value of your physical security initiatives.
Whether you’re a security leader focused on incident management, security risk management, threat protection, or security operations, or simply someone in security looking to improve how you use data, this webinar is perfect for you.
“Best Physical Security Reports” webinar transcript:
Raquel Allen:
Hello, and thank you for joining. Our program will begin shortly. ASIS International presents “Measure What Matters: The Top 10 Physical Security Reports Every Security Leader Should Have.” I’m Raquel Allen, Learning Program Manager at ASIS, and today’s host. We have a great program ahead, but first, a few housekeeping items. Please note today’s presentation will not include the use of webcams.
ASIS International acknowledges the thanks Resolver, a Kroll business, for sponsoring today’s webinar and peer discussion. Resolver helps transform security departments with its end-to-end corporate security platform by integrating their clients’ threat, security, risk incident management, and security operations capabilities.
Resolver enables security teams to use their resources more effectively, reduce the frequency and severity of incidents, and be a strategic business partner within their organization. For more information, visit www.resolver.com.
Centered on your screen are the presentation slides. To the left of the slides, you’ll find today’s speaker’s bios. And under the slides is the Q&A box. If you have a question during the presentation, type it there, and we’ll address it during the Q&A at the end, as time permits. To the left of the slide, you’ll find webinar materials and resources, including today’s presentation slides, as well as other resources provided by Resolver, today’s webinar sponsor.
Along the top and bottom of your screen are images and icons to access additional tools and information. Click or hover over each to explore more. Should you experience any sound or audio disruption during the webinar, please refresh your browser. If additional help or support is needed, click the question mark icon at the bottom of your screen at the end of the webinar, and an evaluation will pop up.
Your feedback helps determine future programming, and your input is appreciated. CPE information: completion of this webinar is eligible for one CPE credit. CPE credit will be updated directly into your user profile within 48 hours after the webinar’s conclusion. Self-reporting of CPE credit is not required.
Today’s presentation is being recorded and will be made available on demand within 48 hours. Nominations for consideration of ASIS awards of excellence are now open through June 15th. Shine a light on a deserving member or organization, their contribution to the profession. Nominate them to be honored with an ASIS Award of Excellence. More information about the nomination process is available in the webinar materials and resources module, again to the right of the slides.
And thank you again for joining today’s webinar, “Measure What Matters: The Top 10 Reports Every Security Leader Should Have,” sponsored by Resolver. I’d now like to introduce and welcome today’s speakers, Ryan Thiessen, VP of Corporate Security Products, and LeeAnn Kincal, Product Marketing Manager, both of Resolver. Hello and welcome to you both. And with that, I will hand things over to you all.
LeeAnn Kincal:
Thanks so much, Raquel. And thanks to everyone joining in on the webinar today. We’re excited to take you through what we’ve put together, show metrics that matter specific to the security industry, and help expand your visibility and make informed decisions to provide even more value across your organization. Raquel did a great job with an overview of Resolver. So we’ll just skip on the agenda.
The agenda has a couple of things we’re going to go over. First, understanding why metrics matter and the power of data and how it can help security teams drive value to the business. Then we’ll go through common barriers that impact leaders like yourself from getting insights but also finding ways to overcome them as well to help you all. Next, we’ll do a deep dive into the top 10 reports that will help drive that value. Lastly, we’ll discuss best practices for visualizing data and strategic decision making.
Starting off with why metrics matter and the power of data. Whether you’re a security leader or a CEO, if you do not have reliable data or are missing key information, you’re making decisions based on a gut feeling and using your professional opinion as best as you can. This is a gamble.
When you have the collection of the right data, it empowers security leaders to make data-informed decisions and use your professional experience, removing that gamble. I want to highlight four key benefits of data capture and how they all influence each other. First, there is increased visibility. The more data you have, the more reports you’re receiving from your staff, the more aware you are of what is happening across your security landscape.
Once you have that increased awareness, it allows your team to draw on clearer insights, helping you understand what’s happening, why it’s happening, where, how often. This could be identifying hotspots or certain times or locations when there’s a higher frequency of incidents, whatever that may be, to help give your team a clearer picture of your landscape.
Taking these and turning them into trends or patterns and using that to develop plans to mitigate incidents or reduce incident severity in the future. From there, you can share these insights and your action plans as a way to influence your key stakeholders.
We know that security departments can sometimes be perceived as a cost center, so being able to show that increased visibility and those insights across your security landscape and providing a strategic plan to prevent those issues moving forward will really help us show and influence your key stakeholders.
With your increased awareness and ability to develop clearer insights and influence your leadership team, you now have the opportunity to lead this into prevention. Take your action plan and implement it, and then whatever you’re specifically measuring. But measure that over time to see how your action plan has prevented incidents, reduced incident severity, or increased operational efficiencies, whatever that may be.
Being able to have that information and sharing it with your key stakeholders and across your organization to show the additional value you bring to the company. We will show you later how these four benefits will be found within the top 10 reports as well.
Now, going into common barriers in generating meaningful insights. We talked about why data is important, but as we know, getting insights can be difficult and also getting the right insights as well. We are going to go through some common barriers that security teams might come across. The first one is having incomplete or missing information. There can be a number of reasons why this can happen.
The first one is having no effective or enforced reporting processes in place. This can lead to staff not necessarily taking incident reporting seriously or a lack of understanding of when to and when not to report an incident. As well as having manual processes in place, like collecting information on paper or through written documents when you are manually completing an incident with a paper form, for example, this increases the chances of missing information.
And with manual forms, this means that staff will have to go out of their way to find this form. And without them not filling this out, this could lead to them forgetting or missing key information once they report on this later. Or it might just mean that they might not report on it at all just due to the inconvenience of this. And then another one is also staff being worried that if they report someone, that individual will find out who reported on them.
So that’s really something that deters people from submitting an incident report. But there are ways to overcome this. First and foremost, having proper processes in place and eliminating manual processes, especially for incident reporting and also having easy access to online forms, not only ensures that staff will fill this out more quickly, but that all information required is being completed within mandatory fields.
This also saves time on your security team from chasing after incidents and getting information as they’ve now collected everything they’ve needed within that original form. Another one is also enabling a reporting culture. Some staff might accept that incidents are going to happen, but there needs to be a shift in perspective that incidents can be prevented no matter how small they are.
And this is something that not only needs to be endorsed from your security team but across the entire company to really build that culture and empower your employees to report. Another way to do this is having confidential means of reporting.
This would be someone could report, and their identity would be protected, so they won’t be scared that someone would find out who reported, and it will empower them to report more often as well. So this can either be an online anonymous portal or even a hotline. But also, again, tying back to it needs to be easy and convenient for them to access, and it’s not a burden for them.
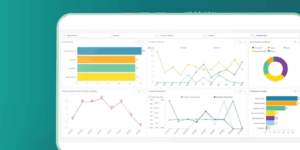
Now onto challenge two. Data visualization and reporting can be overwhelming and difficult to connect the dots, especially when you’re pulling information from a multitude of internal and external sources. A simplified way to do this is through interactive visualization tools displayed in graphs and charts, making it easier for your team to digest all the information and draw conclusions from within a security program.
There are many aspects that can be measured, which will go into detail within those 10 best physical security reports, but whether there is a specific focus that you’re monitoring on, like an incident type or severity, or whether you’re looking for a holistic overview of your security landscape and being able to compile that down into one dashboard and report displaying that. The approach with visualization tools really simplifies this process to help you analyze all of your data regardless of what your focus is.
A couple of ways to overcome this. One very important one is having all your data centralized in one location through data warehousing. Having to go through multiple sources and grab data manually will take a significant amount of time, and it also just gets very unorganized and messy. So having a centralized area where all your data is stored makes it easy for your team to access that data and put it into reporting and dashboards once your data has been centralized.
It’s also important to structure this based on the type of insights that you are looking for. What a financial analyst would look at would be very different from what a security leader is going to look at when reviewing risk data. So it’s important that your data is structured based on your specific needs, so you’re ensuring that you’re collecting accurate insights that are available to your organization and saving you time sorting through large sets of data.
And then from there, making sure that you have other built-in dashboards or integration with flexible visualization tools like Power BI or Tableau, and bringing all your data together and creating reports and dashboards that are showing all of your data. It’s also important to ensure that your data is updated based on real-time within data warehousing.
Once your data has been inputted into the data warehousing and ensuring that that’s being uploaded into your reporting, so you’re having real-time data incorporated within that, and you know right in that moment, this is the most accurate data that you’re reviewing. Once these tools are in place, security teams can then effectively monitor and track their KPIs to reduce incidents from materializing into costly incidents or reduce from reoccurring.
And the last one, challenge three. Once you centralize your data and you’re using your built-in dashboards or your visualization tools, another common challenge that sometimes organizations need to overcome is data consistency.
Although you’re collecting more data, if there are inconsistencies across these, this means that all the information you’re collecting may not be sorted, populated, or filtered correctly with those, and therefore your reporting is not reflecting your information accurately, and your data is skewed. So again, a couple of ways to overcome this are similar.
Going back to challenge one is ensuring that you have those proper processes set up in place, specifically setting up your incident forms to collect the information you need without making it overly complicated and overwhelming your staff, which could potentially deter them from filling out a form or making sure it’s not too vague that you’re missing out on key information. Within this process, you need to determine how to best classify what data you need and reflect it within that form.
Also, having strong workflow and review processes. So making sure you have a second set of eyes on reports if they’re being manually completed, to ensure that everything that you need has been collected. If you’re not able to do this, you can be faced with long hours in reviewing data or chasing staff to make sure that you have the correct information that you need.
And last but not least, tying it together ultimately starting simple. There are so many different ways to approach this and there are so many insights that, you know, as a security team you want to collect, but it can be overwhelming when trying to do everything at once. So we always recommend starting simple and then as your team gets accustomed to this process, then add on as that goes on.
Okay. Awesome. So now that we’ve gone through the top three challenges in data capture, we have a poll question for the group, and we would like to hear your response. So understanding what is your biggest challenge to effective reporting, whether that’s identifying the right points of security information, collecting and integrating various data points from siloed departments and functions, data visualization and analysis to better inform decision making or just being unsure where to start. So we’ll give you all about 60 seconds to complete this.
Raquel Allen:
Thank you so much, LeeAnn. So as everyone responds to the poll question that you see here, just hover your mouse over the answer that best suits your organization’s current practices and click that, hit submit, and it will record your answer. So again, just hover your mouse above the slide there, select the answer that best corresponds with your organization’s current practices, hit submit, and that will record the answer. Great. So we have about 64% of our attendees having responded. So LeeAnn, whenever you’re ready, you can go ahead and reveal the results.
LeeAnn Kincal:
Awesome. All right.
First, thank you to everyone for participating. It seems that there are problems across the board with the challenges we spoke about, but specifically looking at collecting and integrating various data points, that’s definitely a common struggle that we hear about a lot. Having incident information communicated through employee communications, your incident reporting, it can be a big challenge, and we’re hoping today as we walk you through this, you might be able to find some solutions moving forward.
Ryan Thiessen:
Great, thanks. A great recap of the challenges there. And I think the audience agreed for sure that the number one issue is collecting the data and making sure it’s structured in a way that you can visualize and analyze it. You know, I saw the second one was actually seeing the charts and graph and making sense of the data afterward.
But really collection is that initial focus which is really aligned to a lot of the challenges that we’ve seen. And then we look at reporting to help fill those gaps. So the top 10 reports that drive value, a lot of our examples here are going to go through an incident-focused lens, but these concepts really can be applied to lots of different data scenarios.
The first aspect we assess is incidents over time, beginning with what you’re currently measuring. Analyzing data collection frequency helps us spot trends, like spikes or uniform patterns over time. We examine the volume of reports, threats, and service requests, seeking to understand patterns in seasonality, such as winter holidays or summer quiet periods. Trends may be apparent on a yearly basis, or they may be as immediate as weekly changes. It’s crucial to discern trends for each day of the week, which helps anticipate busier or slower periods.
When measuring over time, comparisons to baselines or targets are essential. It’s not always practical to compare with other businesses due to differences in what and how they measure. Instead, compare your current performance against historical data or different areas within your own business.
After gauging the volume of data, we delve deeper into its composition. Data should be categorized, ideally starting with seven to 12 broad categories, then drilled down into subcategories. High-level trends and areas of impact can be identified before investigating specific types for abnormalities.
For those beginning to track incidents, an initial increase in reported incidents is common and reflects better visibility and engagement. It’s vital, however, to also focus on incident severity. If the proportion of critical incidents is decreasing while overall visibility is increasing, it indicates effective countermeasures.
To truly gauge impact, we attempt to assign a dollar value to each incident, accounting for losses and recovery efforts. This quantitative measure allows us to assess the overall exposure and potential savings provided by security programs.
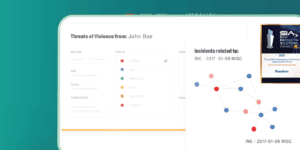
We also measure the effectiveness of security programs themselves. It’s not just about what is happening but how well we monitor and engage with incoming data. Programs like ‘see something, say something’ or confidential reporting are tracked for adoption quality. Metrics like triage time and follow-up closure rates show responsiveness and program success.
Different locations may report incidents differently, so understanding where incidents occur is vital. Comparing incident rates against business size or risk scores can reveal underreporting or actual risk levels.
Lastly, investigating how incidents are reported is key. Multiple reporting methods may be necessary, and understanding successful methods in certain locations can help replicate that success elsewhere. This could involve email, hotlines, mobile portals, or even system integrations.
Once data collection and understanding are solidified, incidents meeting investigation criteria, such as severity or loss thresholds, are examined for root causes. Reports on contributing factors and ineffective controls inform corrective actions. It’s not enough to identify these actions; managing them to completion ensures prevention of future incidents.
Troublesome incidents or a significant number of outstanding issues at specific locations may warrant a security audit or site visit to proactively identify problems. Regular security audits can be implemented as a routine part of security assessments.
The frequency may vary, with higher traffic locations or problematic areas being audited more frequently, while others might have a longer interval between audits. Centralizing the assessments and audits is crucial for maintaining visibility, accountability, and understanding where investments are needed. This also allows for the identification of global common issues that may require worldwide initiatives.
Lastly, team performance reports can pinpoint whether it’s the security team that needs improvement. Performance-based reports help us understand where the team’s time is spent, who is overloaded, who has capacity, and who our top performers are. By reviewing individual performance scorecards, we can guide discussions during reviews, understand case management, and identify where additional training or program review might be necessary.
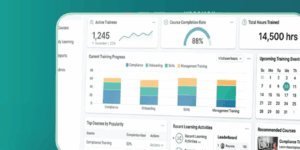
High-level dashboards that focus on a few key metrics provide a snapshot of the overall health of the security function. They enable transparency with leadership and support the push for program improvements. By consolidating various reports into a comprehensive overview, security teams can stay ahead and focus on areas needing attention.
The transformation of fragmented security programs into a more intelligent security approach is key. Security teams must protect assets and people by leveraging data and consolidating data silos to make informed, real-time decisions. Resolver’s suite of applications on a risk intelligence platform supports this transformation by enabling proactive security management, integrating broad reporting capabilities, and ensuring that security teams measure what truly matters.
LeeAnn Kincal:
To tie it all together, an enhanced security solution benefits security teams by simplifying processes, improving decision-making, reducing incident volume and severity, and demonstrating the value of security teams through reports. This supports further investment in strategic initiatives.
Raquel Allen:
Thank you, Ryan and LeeAnn. We have questions from the audience to address. Audience members, please ask your questions using the box below the slides. Type your question, hit submit, and we’ll answer as time allows. Our first question concerns identifying essential fields for incident reports to gain valuable insights. Manual entry by staff may deter reporting, while automated collection must manage data privacy and anonymous reporting. How can we balance these needs to obtain meaningful data?
Ryan Thiessen:
It’s crucial to start with the basics, gaining initial visibility into incidents. Overwhelming users with too many data points can create barriers. We can enrich information post-report using tools like Resolver’s intelligent triage, which uses AI to pull additional data. Integration platforms can structure data from various sources into a common format for incident reports, maintaining anonymity and privacy while still gathering essential information.
Raquel Allen:
Thank you, Ryan. Another question asks about the most impactful graph types for boards or executives. How do we trend with different charts like pie or gauge charts?
Ryan Thiessen:
Boards and executives prefer simple, storytelling graphs. Pie charts are less valuable unless focusing on a particular category. Bar charts or column charts with context, like benchmarks or historical comparisons, are effective. They back up where improvements were made and how programs are performing. Proper visuals support the narrative of security’s impact and can lead to increased budgets and support for programs.
Raquel Allen:
We have time for more questions. One asks about including vulnerability, budget, business engagement reports, and security customer NPSs in addition to the top 10 reports.
Ryan Thiessen:
These additional reports are valuable once you understand the tactical impact of incidents on your business. Tailor security programs to what’s important for your business, as advised by business leaders and boards. Evolve reporting to reflect the impact of your efforts and adjust strategy based on investment results. Triage programs help understand visibility and data challenges, but as you address specific problems like product loss or customer dissatisfaction, develop targeted programs and corresponding reports.
Raquel Allen:
Next, we have a question about benchmarks and best practices for establishing them across different organizations.
Ryan Thiessen:
Benchmarks are challenging to standardize industry-wide due to diverse business models and threats. Set benchmarks based on historical performance and improvements desired. Compare different business units, locations, and teams within your own organization to set internal targets and drive improvements.
Raquel Allen:
All right, thank you. And let’s see here, of the 10 reports you mentioned, what are the top three? If you could only pick three?
Ryan Thiessen:
The top three reports are likely a blend of several types. Data over time is essential, and adding layers such as severity or locations can provide deeper insights. The second priority is developing dashboards for specific programs such as ‘see something, say something’, security training, or workplace violence initiatives, ensuring we understand and measure their adoption and impact. Lastly, risk and issue tracking is vital. After identifying potential improvements, we must ensure accountability and follow-through for remediation and business enhancement.
Raquel Allen:
Fantastic, thank you. Now, a question for LeeAnn: Do you have additional recommendations to improve reporting culture, in addition to anonymous reporting?
LeeAnn Kincal:
Certainly. The implementation of a reporting culture must be company-wide, endorsed by leadership teams to ensure it permeates throughout the organization. Combining top-down enforcement with supportive tools like anonymous reporting will encourage staff participation.
Raquel Allen:
Thank you so much. Sorry, Ryan, go ahead.
Ryan Thiessen:
To add, improving reporting culture is about engagement with the organization. Providing tools and clear communication about their importance, explaining the benefits to employees’ safety and job performance, and approaching it as a partnership are key. Launching programs with clear communication highlights their value and encourages staff to contribute to improvements.
Raquel Allen:
As we’re running short on time, we will have to conclude the Q&A session. We have received many questions and will follow up directly with those who inquired. Thank you, Ryan and LeeAnn, for your expertise and insights, and thanks to Resolver for sponsoring. To our attendees, we appreciate your participation.
Please take a moment to complete the upcoming evaluation to help us shape future webinars. This webinar qualifies for one CPE credit, which will be updated in your profile within 48 hours. There’s no need for self-reporting. Thank you for joining us, and you’ll be redirected to the evaluation shortly.